Plot the Layout of Samples by Covariate Type
plot_layout.RdThis function generates two types of plots for the given layout: one for continuous covariates and another for categorical covariates. It visualizes how samples are allocated across batches, with separate plots for each covariate.
Arguments
- output
A lsit created by
allocate_samples(), containing an item calledlayoutwhich isdata.framecontaining the layout information, including sample IDs, batch allocation, and covariates. Thebatch_allocationcolumn is expected to indicate the batch each sample is assigned to, and covariates can be of numeric or factor type.- id_column
The name of the column in the layout data frame that contains the sample IDs. The default value is "sample_id".
- covariates
A character vector of covariate names to be visualized. The default value is
NULL, which will visualize all covariates in the layout data frame.
Value
A named list containing ggplot2 objects. The list may contain up to two elements:
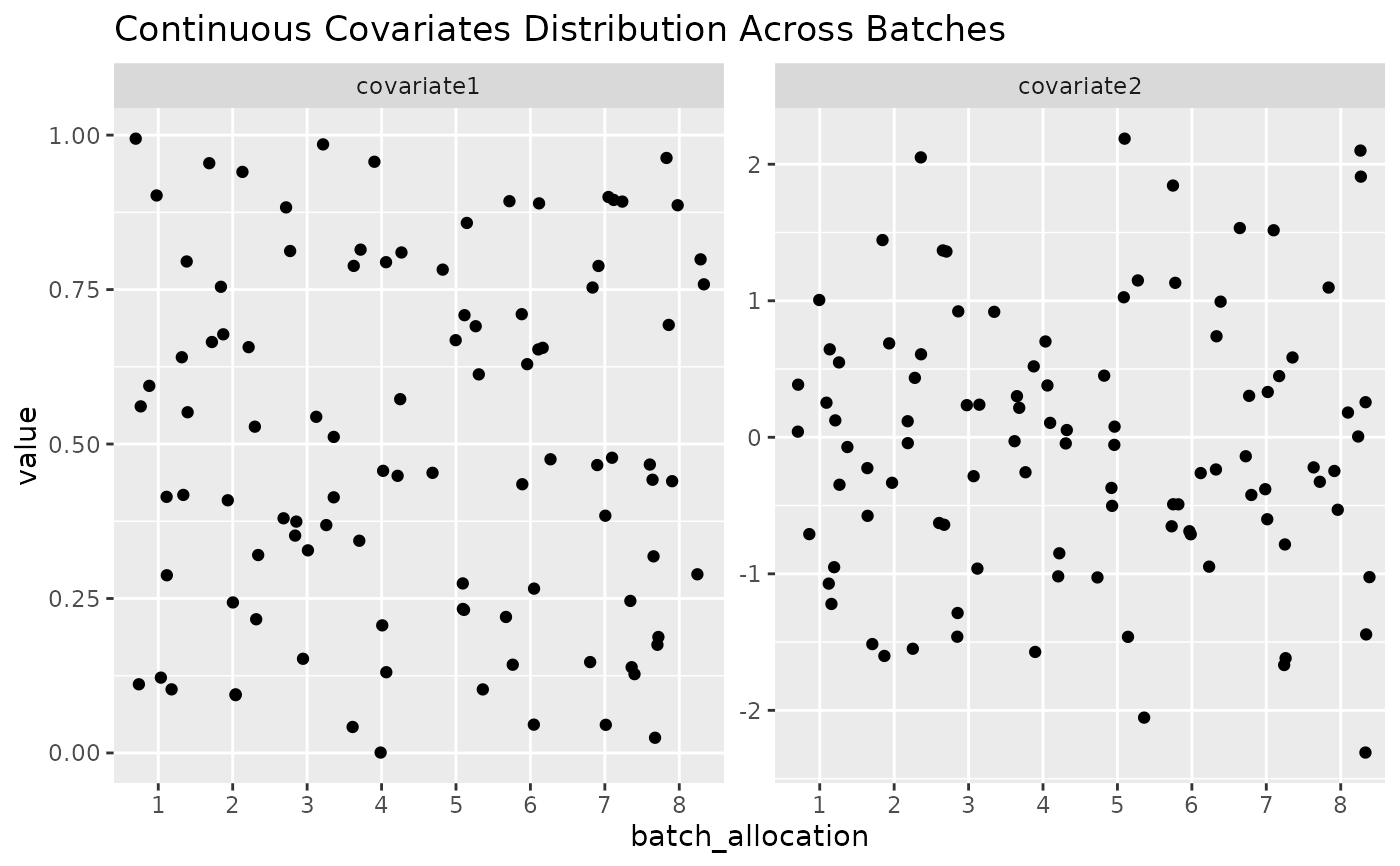
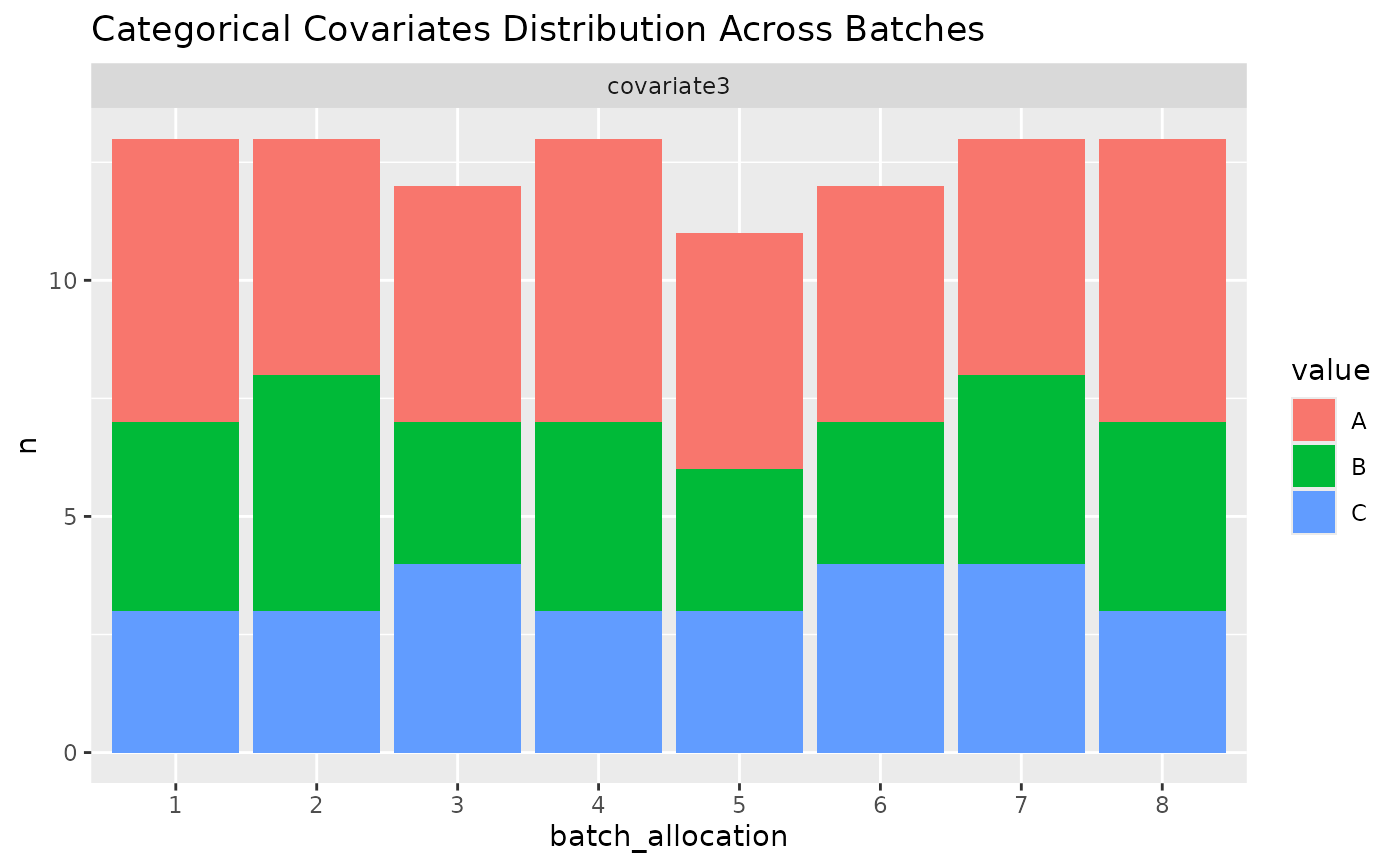
continuous: A ggplot2 object showing the distribution of continuous covariates across batches using scatter plots, with each covariate displayed in a separate facet.categorical: A ggplot2 object showing the distribution of categorical covariates across batches using bar plots, with each covariate displayed in a separate facet and different factor levels shown as different colors.
The returned list will only contain elements for covariate types that are present in the data. If no continuous covariates are found, the continuous element will be absent from the list, and similarly for categorical covariates.
Details
The function first processes the layout to separate continuous and categorical covariates. For continuous covariates, it creates a scatter plot showing the value of each covariate by batch. For categorical covariates, it aggregates the data to count the number of samples in each category by batch and then creates a bar plot. Both plots are faceted by covariate to provide a clear and comparative view of the distribution across batches.
Examples
my_data = simulate_data(n_samples = 100)
allocated_data <- allocate_samples(data = my_data,
id_column = "sample_id",
method = "simulated_annealing",
covariates = c("age_at_baseline", "bmi_at_baseline", "sex"),
batch_size = 13)
#> No blocking variable specified.
#> Covariate: age_at_baseline - continuous
#> Covariate: bmi_at_baseline - continuous
#> Covariate: sex - categorical
#> Number of samples: 100
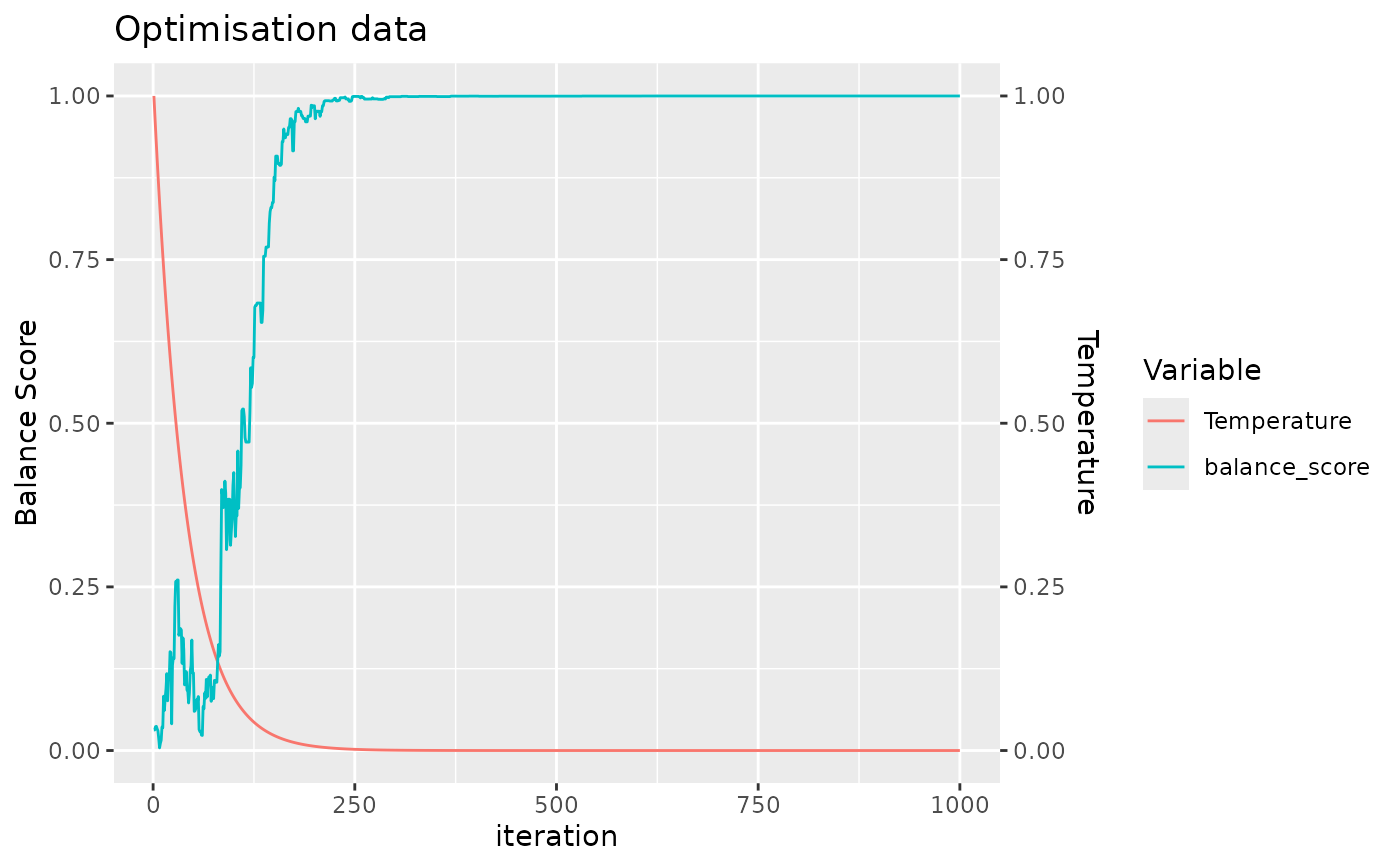 #> Balance Score of final layout: 1
#> Joining with `by = join_by(age_at_baseline, bmi_at_baseline, sex, sample_id)`
plots <- plot_layout(allocated_data, covariates = c("age_at_baseline", "bmi_at_baseline", "sex"))
# View individual plots
plots$continuous # Show continuous covariates plot
#> Balance Score of final layout: 1
#> Joining with `by = join_by(age_at_baseline, bmi_at_baseline, sex, sample_id)`
plots <- plot_layout(allocated_data, covariates = c("age_at_baseline", "bmi_at_baseline", "sex"))
# View individual plots
plots$continuous # Show continuous covariates plot
 plots$categorical # Show categorical covariates plot
 # Save plots
# ggsave("continuous_covariates.png", plots$continuous)
# ggsave("categorical_covariates.png", plots$categorical)
# Save plots
# ggsave("continuous_covariates.png", plots$continuous)
# ggsave("categorical_covariates.png", plots$categorical)